Data analysis software is crucial in helping organizations make data-driven decisions, streamline operations, and gain insights into their business performance. This comprehensive guide will explore the best data analysis software available, broken down into several categories to help you find the right tool for your needs.

What we cover
What Is Data Analysis Software Used For?
Data analysis software helps organizations make sense of their data by collecting, organizing, processing, and interpreting it. These tools enable users to discover patterns, trends, and insights that can help make informed decisions and improve overall business performance.
Types
There are four main types of data analysis that businesses can leverage to gain valuable insights:
Predictive Analysis
Predictive analysis uses historical data to forecast future trends, events, or outcomes. It helps businesses identify potential risks, optimize resource allocation, and improve strategic planning.
Descriptive Analysis
Descriptive analysis focuses on summarizing and interpreting past data to understand what has happened. It uses business intelligence and data mining tools to generate actionable insights and inform decision-making.
Prescriptive Analysis
Prescriptive analysis uses advanced techniques such as optimization and simulation to recommend the best course of action in a given situation. It helps businesses make better decisions, improve efficiency, and maximize their potential.
Diagnostic Analysis
Diagnostic analysis examines historical data to identify the root causes of past events or trends. It helps businesses understand the factors influencing their performance and make data-driven decisions to address challenges more effectively.
Summary of Recommendations
| Category | Software | Type(s) | Price | Free Version Available? | Platforms |
| Best Business Intelligence Tool | SAP Business Objects | Business intelligence, performance management, data analytics, and data management | Contact for pricing | No | Web-based, Windows |
| Most Popular | Microsoft Power BI | Business intelligence, dashboard creation, data visualization, and reporting | Starts at $9.99/user/month | Yes | Web-based, Windows, iOS, Android |
| Best Data Visualization Tool | Tableau | Data visualization, business intelligence | Starts at $70/user/month | Yes (Tableau Public) | Web-based, Windows, macOS |
| Best Data Science Tool | RapidMiner | Business intelligence, data science, data analytics, data preprocessing, modeling, and evaluation | Starts at $2,500/year (RapidMiner Studio) | Yes (RapidMiner Studio Free) | Windows, macOS, Linux |
Typical Features
Most data analysis software comes with the following key features:
- Data Management: Data management tools enable users to import, clean, transform, and integrate data from various sources, ensuring the data is accurate, consistent, and ready for analysis. Data management features often include data extraction, transformation, and loading (ETL) capabilities, data validation, and data deduplication.
- Reporting and Visualizations: Reporting and visualization features allow users to create interactive and customizable reports, charts, and dashboards that help them understand and interpret their data. These features may include a wide range of chart types, such as bar charts, line charts, pie charts, and heat maps, and the ability to create custom visualizations and apply filters and drill-down functionality for more in-depth analysis.
- Statistical Analysis / Qualitative Analysis: Statistical and qualitative analysis features enable users to perform various analyses on their data to identify patterns, trends, and relationships. This may include descriptive statistics, hypothesis testing, correlation analysis, regression analysis, and other advanced statistical methods. Qualitative analysis features may include text analytics, sentiment analysis, and content categorization.
- AI (Artificial Intelligence) and ML (Machine Learning): Data analysis software may also incorporate advanced analytics techniques, such as artificial intelligence and machine learning, to uncover deeper insights and make more accurate predictions. AI and ML features can include natural language processing (NLP), clustering algorithms, classification algorithms, and recommendation systems. These advanced techniques can help users identify patterns and trends that may need to be more readily apparent through traditional analysis methods.
- Dashboard Templates: Dashboard templates are pre-built, customizable layouts that allow users to create professional-looking dashboards and reports quickly and easily. These templates can save time and effort by providing users with a starting point for their data visualization, which can then be tailored to meet their specific needs.
Things to Look For
When selecting data analysis software, consider the following factors:
- Scalability: Ensure the software can handle your organization’s current and future data needs.
- Analytical Diversity: Look for tools that support a wide range of data analytics methods and types to accommodate your business requirements.
- Types of Users: Consider the different types of users within your organization and their specific needs (e.g., data analysts, data scientists, business users).
- Business Requirements: Determine your organization’s specific needs and goals for data analysis, and choose a solution that aligns with those objectives.
- Learning Curve / Ease of Use: Opt for user-friendly software with a relatively low learning curve, ensuring that users can quickly become proficient in its use.
- Integrations and File Support: Choose a tool that seamlessly integrates with your existing systems and supports various file formats for data import and export.
- Pricing: Evaluate your budget and select a data analysis software that offers the needed features at a price point suitable for your organization.
This section will provide a comprehensive list of the best data analysis software available, broken down into several categories to help you find the perfect solution for your needs.
Best Business Intelligence Tools
The following business intelligence software and tools can help organizations gain insights and make data-driven decisions:
SAP Business Objects
A centralized business intelligence suite with robust reporting, data visualization, and analytics capabilities.
- Type(s): Business intelligence, performance management, data analytics, and data management
- Price: Contact for pricing
- Free Version Available: No
- Platforms: Web-based, Windows
- Website / Download Link: SAP Business Objects
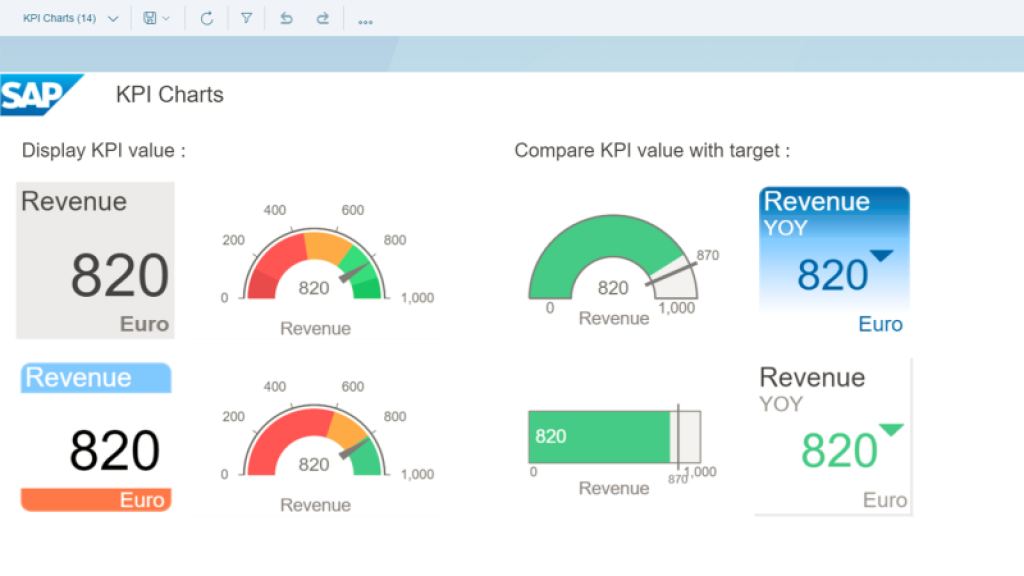
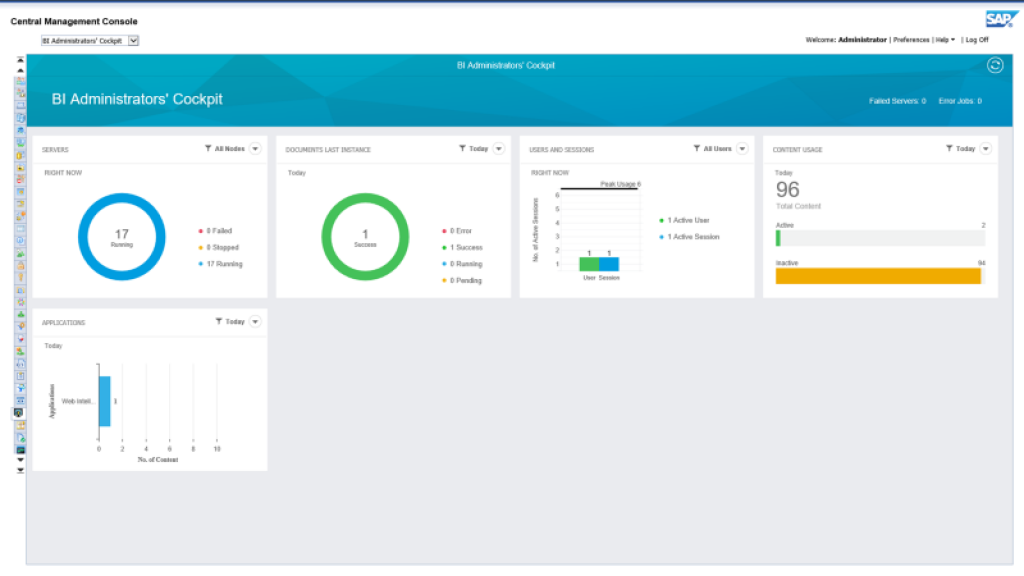
SAP Business Objects is a business intelligence suite designed for enterprises looking to make data-driven decisions. It offers many tools, including reporting, data visualization, and analytics capabilities.
The platform provides an intuitive user interface, making it easy for users to create insightful reports and dashboards.
With its robust feature set, SAP Business Objects is well-suited for large organizations with complex data analysis needs.
SAP Business Objects has various pricing options based on the size and needs of the organization.
There is a “SAP BusinessObjects Edge” edition for small businesses, while larger enterprises can opt for the “SAP BusinessObjects Enterprise” edition. Prices may vary depending on the package selected and the number of users.
To get an accurate quote, it is best to contact SAP directly or consult with an authorized SAP partner.
Key Features
- Ad-hoc reporting
- Interactive data visualizations
- Predictive analytics
Why You Should Consider
SAP Business Objects is a comprehensive solution that caters to the needs of large enterprises with complex data analysis requirements. It offers robust reporting and analytics capabilities, making it a top choice for organizations looking to make data-driven decisions.
Microsoft Power BI
A popular business intelligence tool that enables users to create interactive reports and dashboards for data analysis and visualization.
- Type(s): Business intelligence, dashboard creation, data visualization, and reporting
- Price: Starts at $9.99/user/month
- Free Version Available: Yes
- Platforms: Web-based, Windows, iOS, Android
- Website / Download Link: Microsoft Power BI
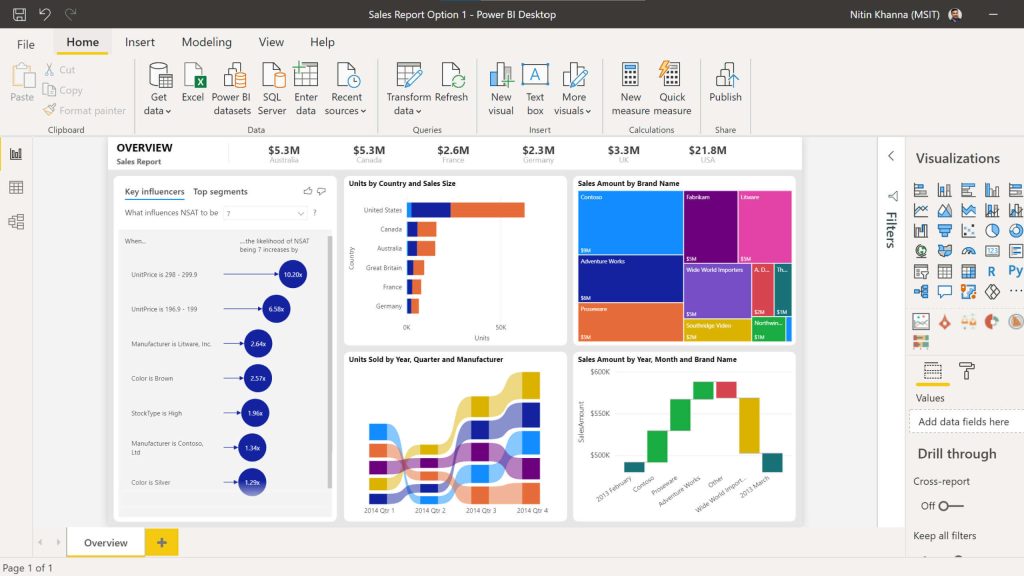
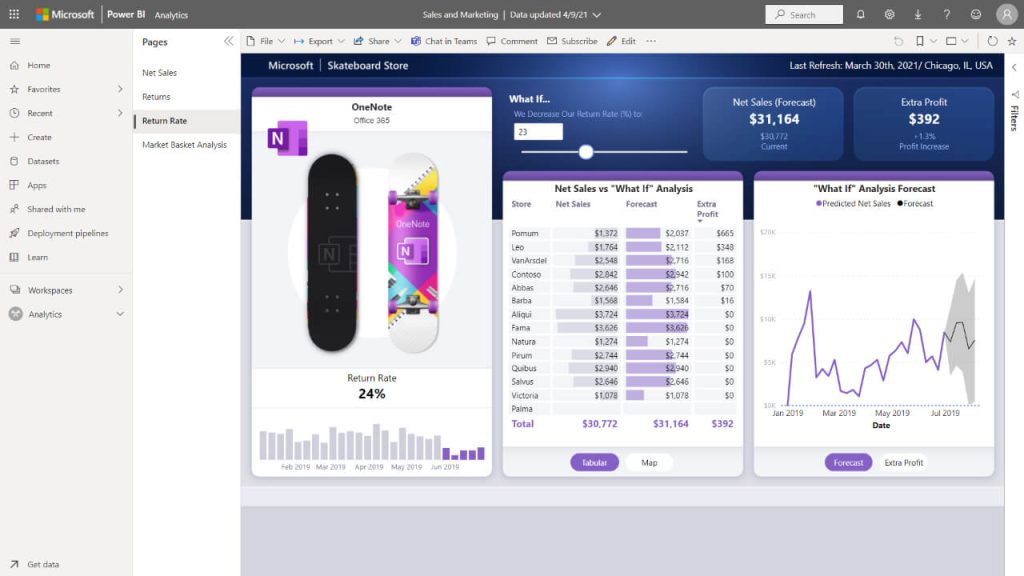
Microsoft Power BI is a widely-used business intelligence tool that helps organizations analyze and visualize their data.
Its intuitive drag-and-drop interface makes it easy for users to create interactive reports and dashboards.
Power BI also offers seamless integration with other Microsoft products, such as Excel and Azure, allowing users to leverage their existing tools and infrastructure.
Microsoft Power BI has three pricing plans: Power BI Free, Power BI Pro, and Power BI Premium.
Power BI Pro is priced at $9.99 per user per month. This plan allows users to share reports and collaborate on dashboards within their organization.
On the other hand, Power BI Premium is aimed at larger enterprises, and this plan starts at $20,000 per month (dedicated cloud) or $20,000 per month for on-premises dedicated hardware. The premium plan offers enhanced performance, more extensive data capacity, and advanced administration features.
Key Features
- Drag-and-drop report creation
- Custom visualizations
- Integration with Microsoft products
Why You Should Consider
Microsoft Power BI is a popular choice for organizations looking for an easy-to-use business intelligence tool with seamless integration with other Microsoft products. Its powerful data visualization capabilities make it an excellent option for creating interactive reports and dashboards.
Zoho Analytics
A self-service BI and data analytics platform that enables users to create insightful reports and dashboards.
- Type(s): Business intelligence, data analytics
- Price: Starts at $24/user/month
- Free Version Available: Yes (limited features)
- Platforms: Web-based, iOS, Android
- Website / Download Link: Zoho Analytics
Zoho Analytics is a user-friendly, self-service BI and data analytics platform that allows users to create custom reports and dashboards. Its drag-and-drop interface enables users to easily create visually appealing reports and dashboards, even with minimal technical expertise.
Zoho Analytics also integrates with various other Zoho products and third-party applications, providing a seamless experience for users. It supports multiple data sources, including cloud storage, web feeds, and popular business applications.
With Zoho Analytics, users can perform data blending and data modeling and apply machine learning algorithms for predictive analytics.
This platform offers a variety of pricing plans to suit different needs. The Basic plan supports limited users and rows with daily data synchronization.
As you move up to higher-tier plans such as Standard, Premium, and Enterprise, you’ll find increased user support, more rows, and more frequent data synchronization, with the highest plans offering near-real-time syncing.
Key Features
- Drag-and-drop report creation
- Data blending
- Integration with Zoho suite and third-party applications
Why You Should Consider
Zoho Analytics is an excellent option for small to medium-sized businesses looking for a self-service BI and data analytics tool that is easy to use and offers seamless integration with other Zoho products and third-party applications.
Domo
A powerful business intelligence and data visualization platform providing real-time data-driven decision-making insights.
- Type(s): Business intelligence, data visualization, and analysis
- Price: Contact for pricing
- Free Version Available: No, only a free trial
- Platforms: Web-based, iOS, Android
- Website / Download Link: Domo
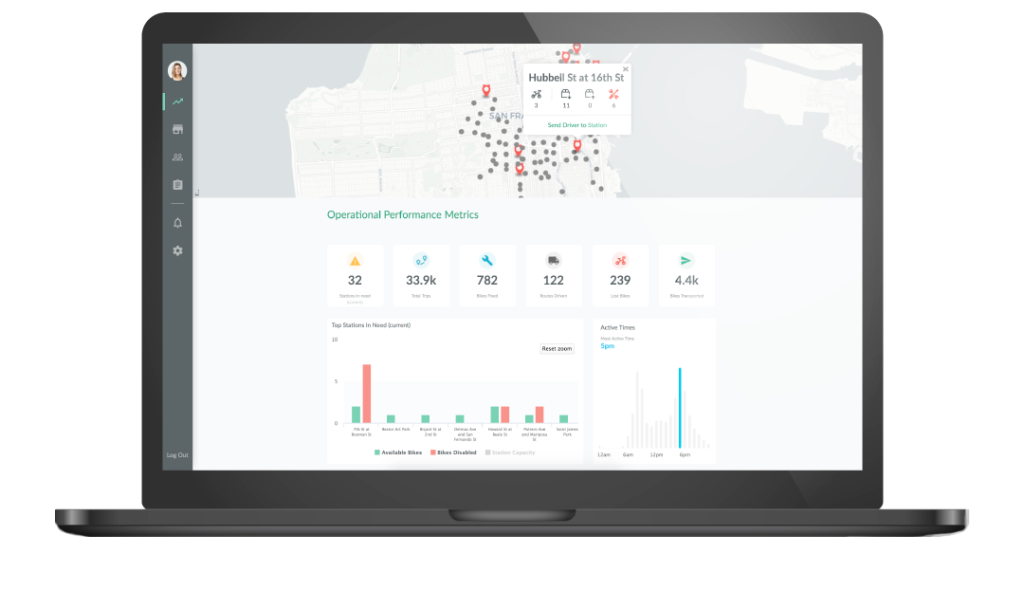
Domo offers a business intelligence and data visualization platform to provide real-time data-driven decision-making insights.
Its cloud-based architecture allows users to access data from multiple sources and create interactive dashboards and reports.
Domo offers a wide range of pre-built connectors, making integrating with various data sources and applications easy.
Domo’s pricing structure is customized based on individual business needs and requirements. To get an accurate price, businesses need to contact Domo directly for a quote.
The company offers three editions: Starter, Professional, and Enterprise, each with different features and capabilities tailored to the size and complexity of your organization.
Key Features
- Real-time data updates
- Pre-built connectors for data integration
- Customizable dashboards
Why You Should Consider
Domo is well-suited for organizations seeking a powerful business intelligence and data visualization tool that offers real-time insights and seamless data integration. Its cloud-based architecture ensures that data is always up-to-date and easily accessible.
TIBCO
A suite of various BI tools, including data science, data visualization, and data management solutions.
- Type(s): Business Intelligence, data science, visualization, and management
- Price: Contact for pricing
- Free Version Available: No, only a 30-day free trial (Spotfire, Data Science, and Jaspersoft)
- Platforms: Web-based, Windows, macOS
- Website / Download Link: Spotfire, Data Science, Jaspersoft
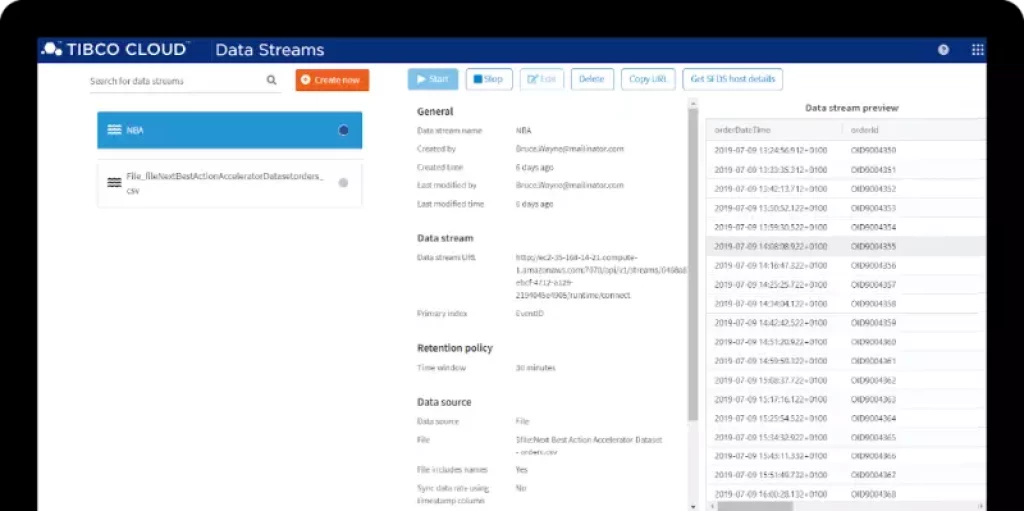
TIBCO provides a diverse suite of business intelligence tools designed to cater to different data analysis requirements. Some of the most popular tools are TIBCO Spotfire, TIBCO Data Science, and TIBCO Jaspersoft.
TIBCO Spotfire is a powerful data visualization and analytics platform that enables users to create interactive dashboards, reports, and visualizations. It supports various data sources and formats and offers built-in support for advanced analytics, such as predictive and geospatial analysis.
Spotfire’s user-friendly interface makes it easy for users with varying levels of technical expertise to explore, analyze, and visualize data, allowing organizations to gain valuable insights and make data-driven decisions.
Meanwhile, Data Science is a collaborative data science platform that facilitates the development, deployment, and management of machine learning and AI models.
It supports various data science languages like R, Python, and Scala and integrates with popular machine learning libraries. TIBCO Data Science’s collaborative environment allows data scientists, analysts, and business users to work together, streamlining the process of developing and deploying analytics solutions.
The third popular tool, Jaspersoft, is a reporting and analytics platform designed for embedding into applications.
It offers a range of reporting and visualization features, including pixel-perfect reports, interactive reports, and ad hoc reporting. With its flexible architecture, Jaspersoft can easily integrate with various applications and data sources, providing users with real-time, actionable insights within their application environment.
Key Features
- Comprehensive BI suite
- Advanced data science capabilities
- Customizable data visualizations
Why You Should Consider
TIBCO is an excellent choice for organizations looking for a comprehensive suite of advanced BI tools that cater to various data analysis needs, including data science, data visualization, and data management.
Sisense
A business intelligence and data visualization platform that simplifies complex data analysis and empowers users to make data-driven decisions.
- Type(s): Business intelligence, data analytics, and data
- management
- Price: Contact for pricing
- Free Version Available: No, only a free trial
- Platforms: Web-based, Windows, macOS
- Website / Download Link: Sisense
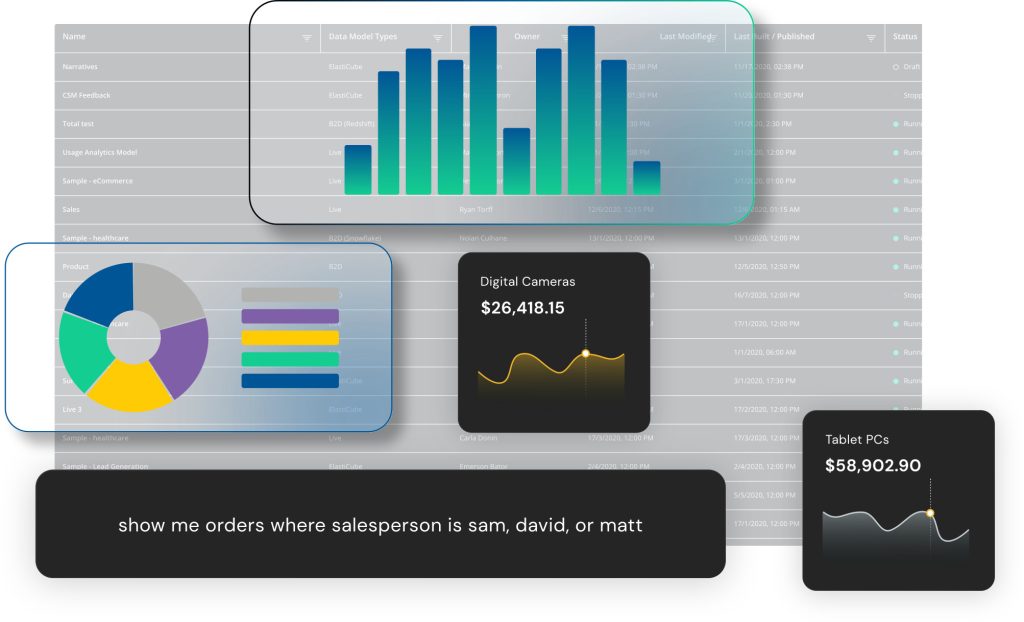
Sisense is a powerful business intelligence and data visualization platform that simplifies the process of analyzing complex data. It provides users with a range of tools and features, such as its Elasticube technology for data modeling, In-Chip engine for faster processing, and Sisense BloX for creating custom visualizations and dashboard applications.
The Elasticube technology allows users to connect to multiple data sources and create data models with ease, while the In-Chip engine accelerates data processing by utilizing the computer’s hardware.
Sisense BloX empowers users to create custom dashboard applications using a simple drag-and-drop interface, allowing organizations to build tailored visualizations without extensive technical knowledge.
Sisense offers a custom pricing model based on factors such as the number of users, data volume, and specific features required. To obtain an accurate pricing estimate, it is best to contact Sisense directly for a tailored quote.
Key Features
- Interactive data visualizations
- Data integration capabilities
- Customizable dashboards
Why You Should Consider
Sisense is an excellent option for organizations looking for a user-friendly business intelligence and data visualization tool that simplifies complex data analysis and enables data-driven decision-making.
IBM Cognos
A BI and performance management platform that offers advanced analytics and reporting capabilities.
- Type(s): Business Intelligence, Performance Management
- Price: Contact for pricing
- Free Version Available: No, only a free 30-day trial
- Platforms: Web-based, Windows, macOS
- Website / Download Link: IBM Cognos
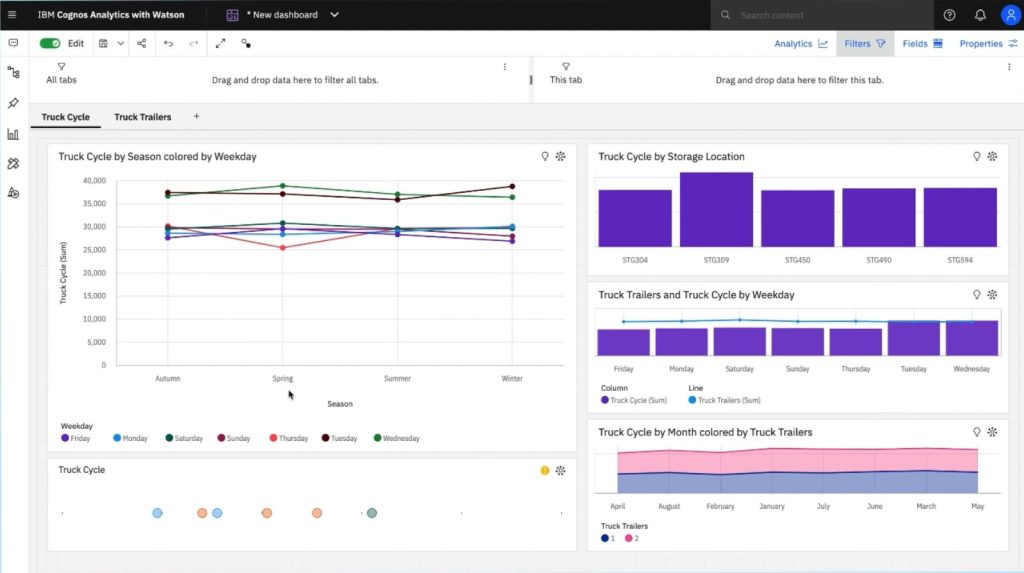
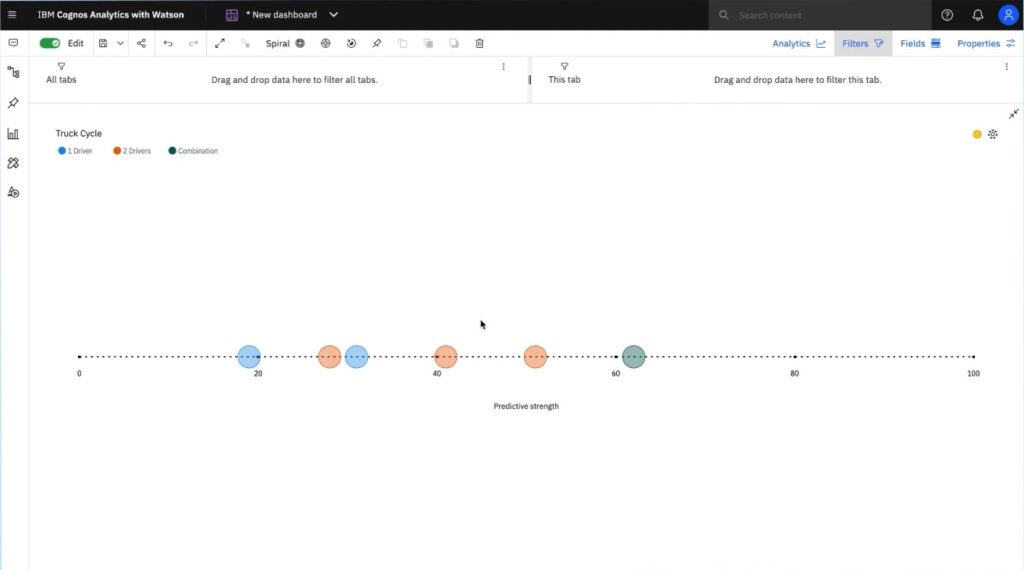
IBM Cognos is a versatile business intelligence and performance management platform with advanced analytics and reporting capabilities. Its robust feature set includes several specific tools, such as:
- Cognos Analytics: A BI and data visualization tool that enables users to create interactive reports, dashboards, and data stories. It helps organizations gain valuable insights from their data by simplifying the process of data exploration and analysis.
- Cognos Data Manager: A data integration and ETL (extract, transform, load) tool that helps businesses combine data from multiple sources and create a unified view of their data. This enables organizations to understand their data better and make data-driven decisions.
- Cognos Framework Manager: A metadata modeling tool that allows users to create and manage business models for their organization. This helps in creating consistent and accurate reports and dashboards across the organization.
- Cognos TM1: An effective planning, budgeting, and forecasting tool that helps organizations streamline their financial planning process and improve their overall financial performance.
- Cognos Planning Analytics: An advanced planning, budgeting, and forecasting solution that leverages predictive analytics to help organizations make better, data-driven decisions
These tools and other features within the IBM Cognos suite provide organizations with a comprehensive solution for their complex data analysis needs.
The platform is designed to be scalable, ensuring that it can grow with your organization and continue to support your data analysis requirements.
Key Features
- Advanced analytics capabilities
- Data integration and modeling tools
- Predictive analytics
Why You Should Consider
IBM Cognos is a top choice for large organizations with complex data analysis requirements, offering a comprehensive suite of advanced analytics and reporting tools that can help drive data-driven decision-making.
ThoughtSpot
A business intelligence search engine tool allowing users to quickly find and analyze relevant data.
- Type(s): Business intelligence, data search, visualization, integration
- Price: Contact for pricing
- Free Version Available: Free trial and demo
- Platforms: Web-based, Windows, macOS
- Website / Download Link: ThoughtSpot
ThoughtSpot is a unique business intelligence search engine tool that offers several innovative features to help users quickly find and analyze relevant data. Some of its key features include:
- Search-driven analytics: ThoughtSpot’s AI-driven search capabilities enable users to quickly uncover insights and trends in their data by simply typing in a search query. This makes it easy for users without extensive technical expertise to perform data analysis.
- SpotIQ: An AI-driven analytics engine that automatically uncovers hidden insights within your data. SpotIQ learns from user behavior and tailors its results to each user’s preferences, providing personalized insights and recommendations.
- Embedded analytics: ThoughtSpot’s platform can be embedded within other applications, allowing users to access its powerful search and analytics capabilities without leaving their existing workflows.
These features and other capabilities offered by ThoughtSpot make it an innovative and user-friendly solution for organizations looking to simplify their data analysis processes and empower their employees to make data-driven decisions.
Key Features
- AI-driven search capabilities
- Integration with multiple data sources
- Interactive data visualizations
Why You Should Consider
ThoughtSpot is an innovative solution for organizations looking for a user-friendly business intelligence tool that allows users to quickly find and analyze relevant data through a simple search interface.
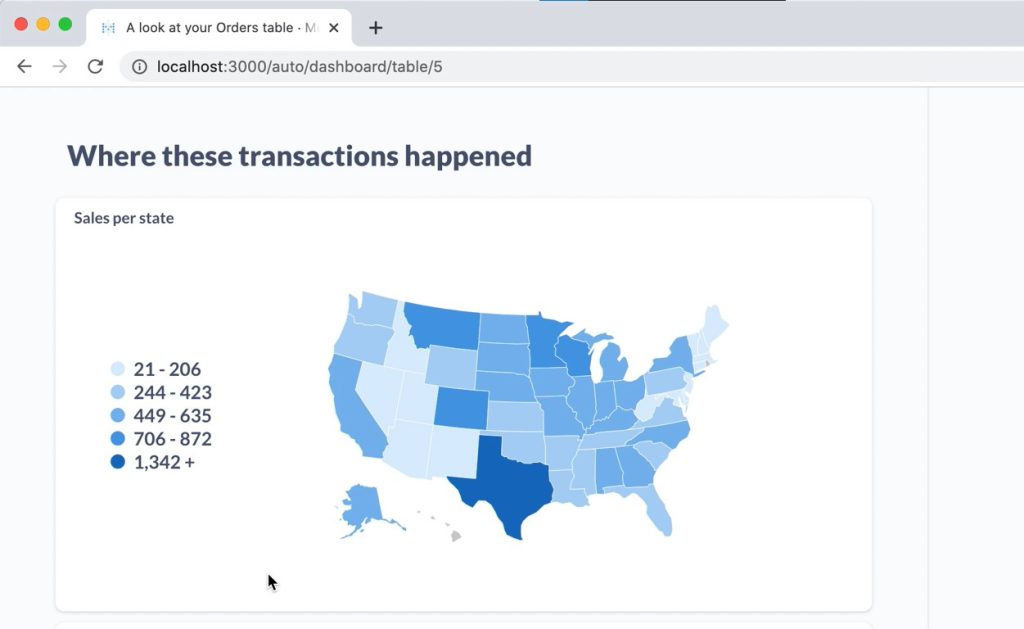
Metabase
An open-source BI tool that enables users to create custom dashboards and reports.
- Type(s): Business intelligence, data visualization, analytics, and reporting
- Price: Metabase offers four versions: Open Source (free), Starter ($85/month), Pro ($400/month), and Enterprise (custom pricing).
- Free Version Available: Yes
- Platforms: Web-based, Windows, macOS, Linux
- Website / Download Link: Metabase
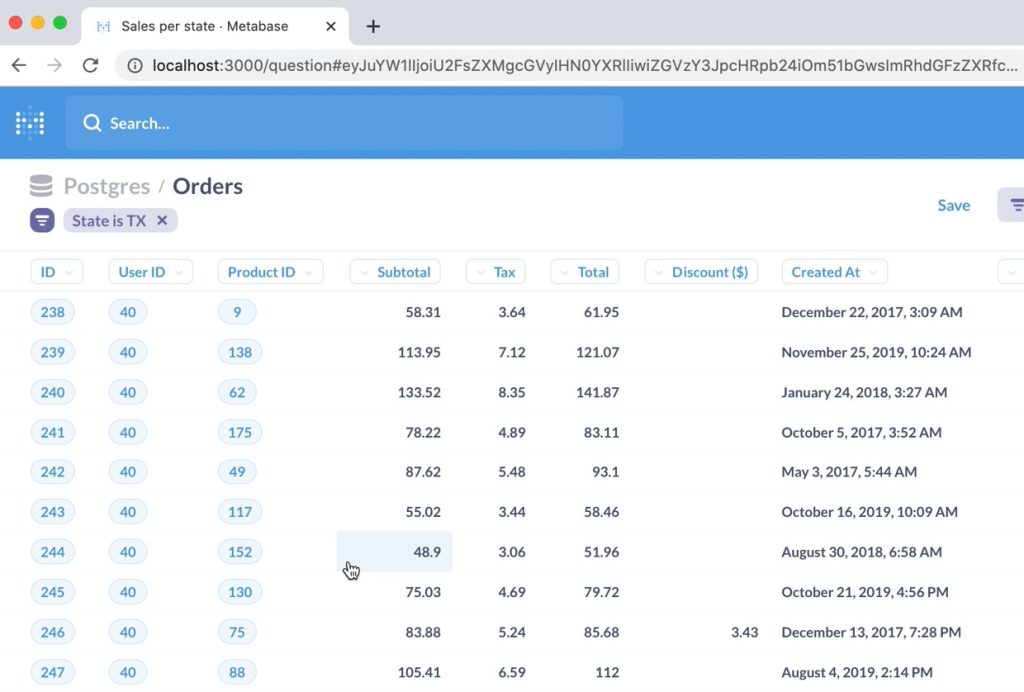
Metabase is an open-source business intelligence tool focusing on ease of use and accessibility. Some of its key features include:
- Custom dashboards: Metabase allows users to create custom dashboards using a simple drag-and-drop interface. Users can add various charts, tables, and visualizations to their dashboards, making it easy to create visually appealing reports.
- Data visualization: Metabase offers a variety of data visualization options, such as bar charts, line charts, pie charts, and more, to help users better understand their data.
- SQL editor: For users with more advanced technical skills, Metabase includes a built-in SQL editor that allows them to write custom queries for more in-depth analysis.
- Data integration: Metabase supports a wide range of data sources, including relational databases, NoSQL databases, and cloud-based storage platforms, making it a versatile option for organizations with diverse data analysis needs.
By offering an open-source solution with a user-friendly design, Metabase has become a popular choice for organizations seeking an accessible and cost-effective business intelligence tool.
Key Features
- Open-source and free to use
- User-friendly interface
- Supports a wide range of data sources
Why You Should Consider
Metabase is a great option for organizations looking for a cost-effective, user-friendly business intelligence tool that supports a wide range of data sources and allows for easy customization of dashboards and reports.
Best Data Visualization Tools
Tableau
A leading interactive data visualization and BI platform that helps users make sense of complex data.
- Type(s): Data visualization, business intelligence
- Price: Starts at $70/user/month
- Free Version Available: Yes (Tableau Public)
- Platforms: Web-based, Windows, macOS
- Website / Download Link: Tableau
Tableau is a leading data visualization and business intelligence platform that empowers users to create interactive, shareable dashboards.
The platform offers a user-friendly, drag-and-drop interface that makes it simple for individuals with varying levels of technical expertise to design visually appealing data visualizations.
Tableau’s suite of tools includes Tableau Desktop, Tableau Server, Tableau Online, and Tableau Public.
Tableau Desktop is designed for individual users and data analysts, while Tableau Server and Tableau Online facilitate collaboration and sharing of data visualizations within organizations.
Tableau Public is a free version that allows users to create and share visualizations on the public platform.
The platform integrates with a wide range of data sources, including databases, spreadsheets, and cloud-based applications, making it a versatile option for organizations with diverse data analysis requirements.
Tableau also offers robust data preparation and ETL (extract, transform, load) capabilities, which streamline the process of combining and cleaning data from multiple sources.
Key Features
- Interactive data visualizations
- Drag-and-drop interface
- Wide range of supported data sources
Why You Should Consider
Tableau is a top choice for organizations looking for a powerful data visualization and business intelligence tool that offers an intuitive interface and supports a wide range of data sources.
Qlik
A data visualization and business intelligence platform that provides users with self-service data analysis capabilities.
- Type(s): Business intelligence, data analytics, visualization, and management, and performance management
- Price: Starts at $30/user/month (Qlik Sense Business)
- Free Version Available: Yes, Qlik offers a free trial for both Qlik Sense Business and Qlik Sense Enterprise
- Platforms: Web-based, Windows, macOS, Linux
- Website / Download Link: Qlik
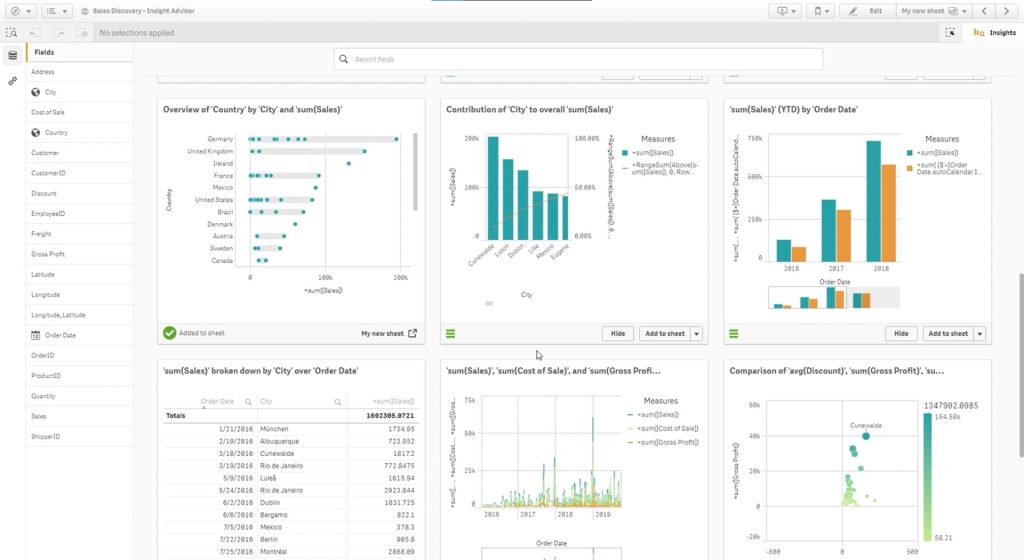
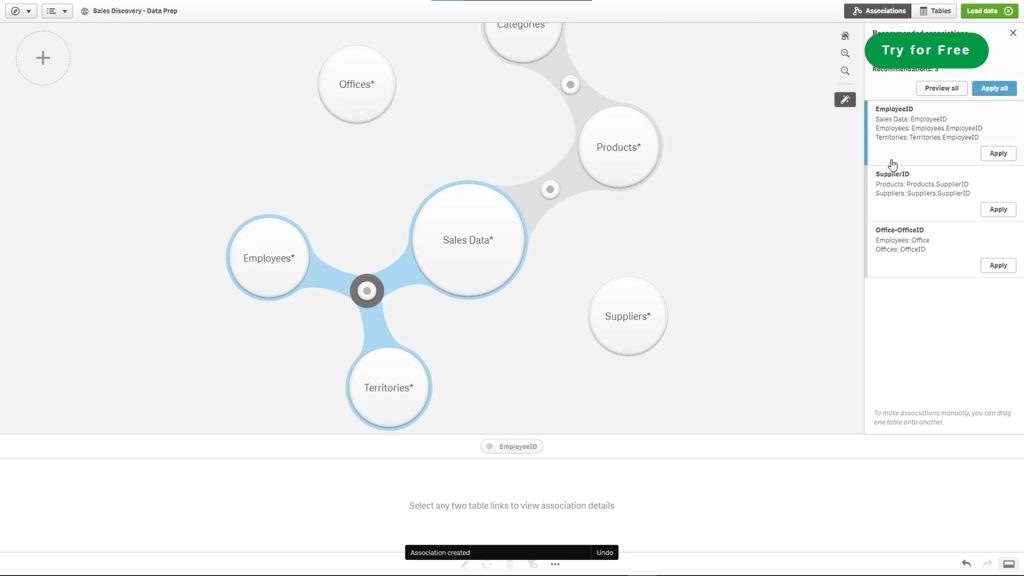
Qlik is a data visualization and business intelligence platform that provides users with self-service data analysis capabilities.
Its unique associative analytics engine allows users to explore data connections and uncover hidden insights by enabling them to ask questions and discover relationships within their data.
The Qlik platform consists of two main products: Qlik Sense and QlikView.
Qlik Sense is a cloud-based solution designed for modern data analytics, providing a responsive, drag-and-drop interface that simplifies the process of creating and sharing visualizations.
QlikView, on the other hand, is an on-premise solution that offers guided analytics and a more customizable environment for developers.
Qlik supports a wide range of data sources and offers robust data integration capabilities, making it easy for organizations to bring together data from multiple sources for comprehensive analysis.
Additionally, Qlik provides advanced features such as real-time data updates, geospatial analysis, and predictive analytics, catering to the needs of organizations with complex data analysis requirements.
Key Features
- Associative analytics engine
- Self-service data analysis
- Robust data integration capabilities
Why You Should Consider
Qlik is an excellent option for organizations looking for a comprehensive data visualization and business intelligence platform that offers self-service data analysis capabilities and robust data integration.
Looker Studio (formerly Google Data Studio)
A free data visualization tool that allows users to create custom, interactive reports and dashboards.
- Type(s): Data visualization, analytics, management, and business intelligence
- Price: Free
- Free Version Available: Yes
- Platforms: Web-based
- Website / Download Link: Looker Studio
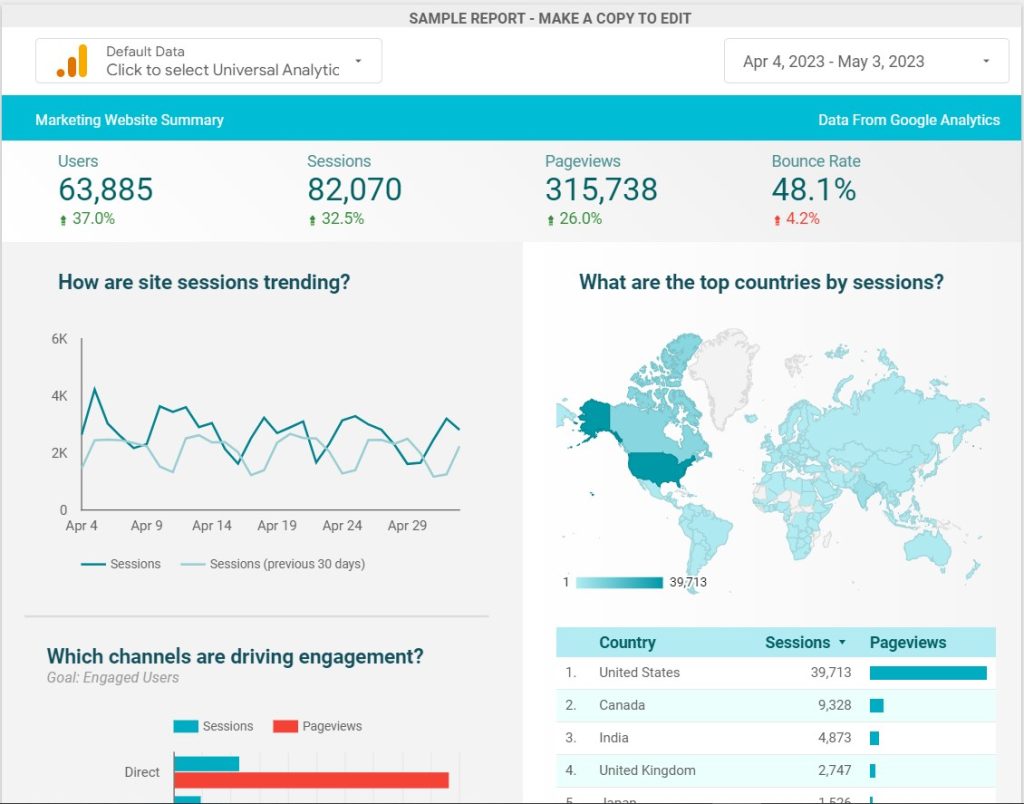
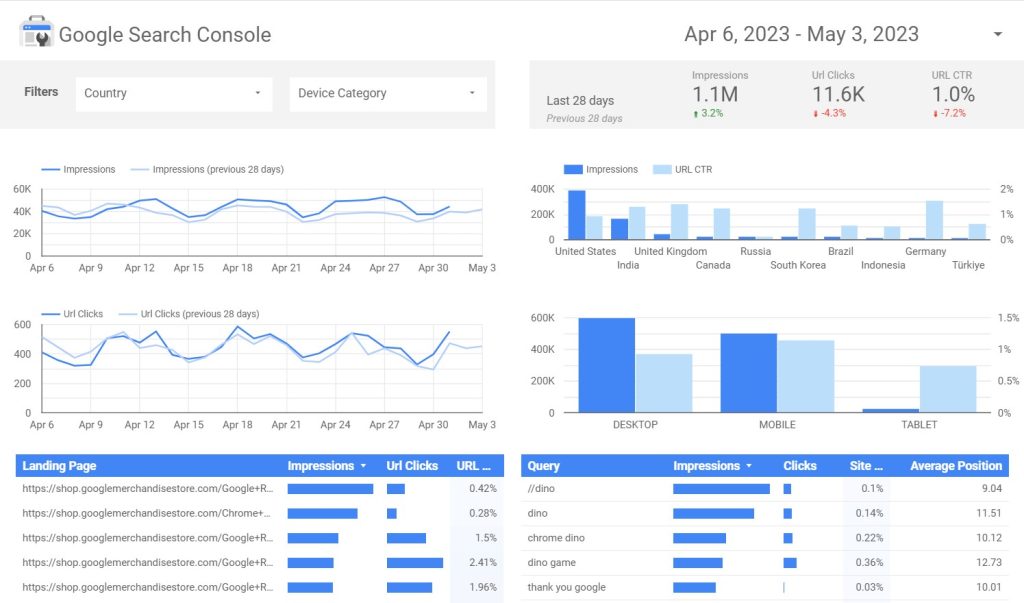
Looker Studio, formerly known as Google Data Studio, is a self-service, web-based data visualization tool that enables users to create and share interactive dashboards and reports from various data sources. Google officially rebranded the product to Looker Studio in October 2022.
Looker Studio aims to make data visualization easy and accessible for everyone without requiring any coding or software installation.
Looker Studio’s key features include an intuitive report editor with a user-friendly, drag-and-drop interface that allows users to easily create visually appealing reports and dashboards.
The platform also provides a template library for report customization and supports over 800 data connectors for seamless integration with various data sources, including Google Workspace, Cloud Identity, and partner connectors.
The Looker Studio API enables users to automate the management and migration of assets. At the same time, the platform’s report embedding feature allows for easy sharing of insights on web pages or intranets. Real-time collaboration and sharing are also supported, facilitating effective teamwork.
Meanwhile, Looker Studio Pro is a paid version of Looker Studio that provides all the features of Looker Studio along with additional enhanced enterprise capabilities and technical support.
Key Features
- Free to use
- Intuitive report editor
- Looker Studio API
Why You Should Consider
Looker Studio is an easy-to-use, free data visualization tool with extensive data connector support, catering to users with limited technical expertise and offering advanced analytics as part of the Looker platform.
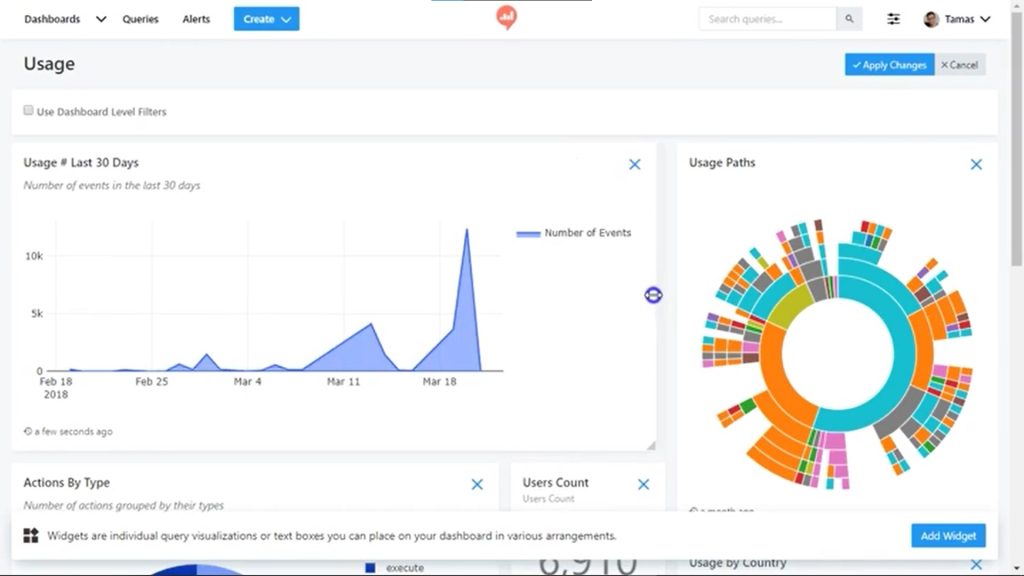
Redash
A data visualization tool that enables users to create shareable, interactive dashboards from a variety of data sources.
- Type(s): Data visualization, business intelligence
- Price: Free
- Free Version Available: Yes (Redash Open Source)
- Platforms: Web-based, Self-hosted
- Website / Download Link: Redash
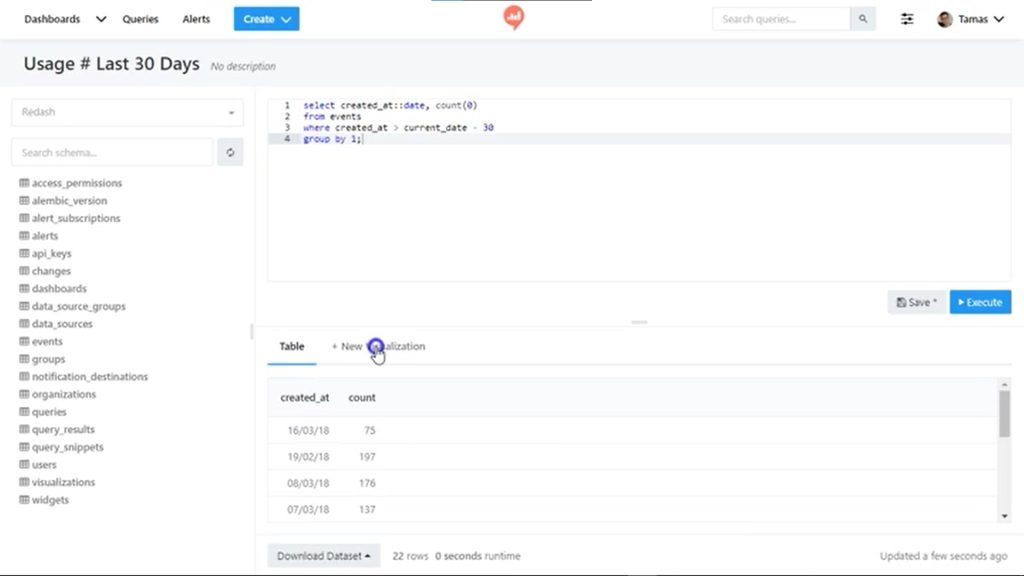
Redash is a versatile data visualization and exploration platform that allows users to seamlessly connect to various data sources, write SQL queries, create charts, and design interactive dashboards for sharing insights with others.
Its user-friendly interface simplifies the process of connecting to a wide range of data sources, including SQL databases, cloud services, and APIs, enabling users with varying technical expertise to create and edit queries, visualizations, and dashboards effortlessly.
Some key features of Redash include cross-data source queries, which allow users to combine data from different sources, customizable alerts to keep users informed of critical changes in their data, and a strong community that provides support and resources for users.
The platform has garnered positive reviews from users who appreciate its ease of use, flexibility, and cost-effectiveness.
Key Features
- Intuitive query editor
- Supports a wide range of data sources
- Powerful collaboration features
Why You Should Consider
Redash is a great choice for organizations looking for a versatile data visualization tool that supports a wide range of data sources and offers powerful collaboration features.
Best Data Science Tools
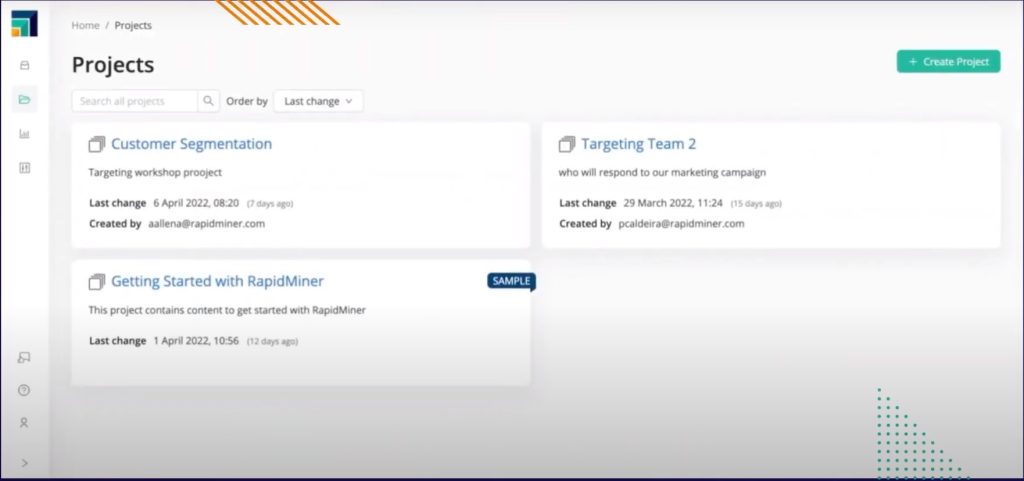
RapidMiner
A data visualization and data science platform that offers a variety of tools for data preprocessing, modeling, and evaluation.
- Type(s): Business intelligence, data science, data analytics, data preprocessing, modeling, and evaluation
- Price: Starts at $2,500/year (RapidMiner Studio)
- Free Version Available: Yes (RapidMiner Studio Free)
- Platforms: Windows, macOS, Linux
- Website / Download Link: RapidMiner
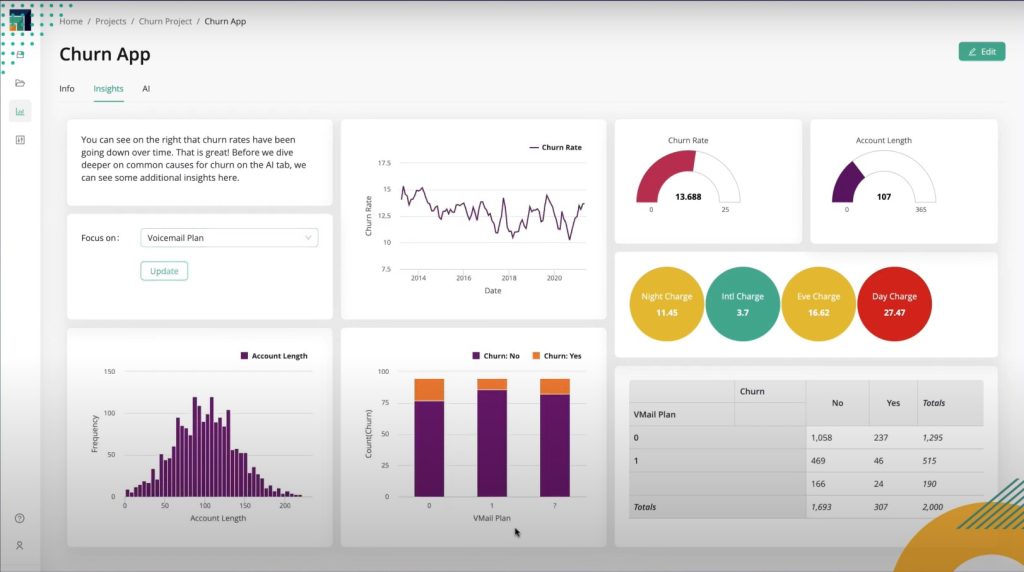
RapidMiner is a data science platform that provides a variety of tools for data preprocessing, modeling, evaluation, and visualization. Its visual workflow designer allows users to easily create, test, and deploy data models without extensive coding knowledge.
The platform supports a wide range of data sources, ensuring seamless integration with diverse data sets.
Additionally, RapidMiner offers powerful collaboration features, making it easy for teams to work together on data science projects.
RapidMiner stands out for its user-friendly interface and extensive library of pre-built data science algorithms and models. This enables users to quickly develop and iterate on their data models, reducing the time and effort required to generate valuable insights.
RapidMiner also provides robust data preprocessing capabilities, allowing users to clean, transform, and enrich their data before modeling.
Key Features
- Visual workflow designer
- Comprehensive data preprocessing, modeling, and evaluation tools
- Wide range of supported data sources
Why You Should Consider
RapidMiner is an excellent choice for organizations looking for a comprehensive data visualization and data science platform that offers a variety of tools for data preprocessing, modeling, and evaluation.
KNIME
An open-source data science platform that allows users to create and deploy data-driven workflows.
- Type(s): Data science, data analytics, data management, data integration, machine learning, and big data processing
- Price: Free (KNIME Analytics Platform), Contact for pricing (KNIME Server)
- Free Version Available: Yes
- Platforms: Windows, macOS, Linux
- Website / Download Link: KNIME
KNIME is an open-source data science platform that allows users to create and deploy data-driven workflows using an intuitive, drag-and-drop interface.
By providing a wide range of pre-built nodes and modules, users can design complex workflows without extensive coding knowledge.
KNIME supports numerous data sources, making it easy to integrate and manage diverse data sets within a single platform.
One of the key strengths of KNIME is its flexibility, allowing users to customize and extend its functionality with additional nodes, community extensions, or custom scripts.
Furthermore, the platform provides powerful collaboration features, such as shared repositories and version control, enabling teams to work together effectively on data science projects.
KNIME also offers robust data preprocessing and transformation capabilities and integrated machine learning and big data processing tools.
This makes it an excellent choice for organizations looking to streamline their data science workflows and generate actionable insights from their data.
Key Features
- Open-source
- Drag-and-drop interface for creating workflows
- Wide range of supported data sources
- Powerful collaboration features
Why You Should Consider
KNIME is a great choice for organizations looking for an open-source data science platform that allows users to create and deploy data-driven workflows without extensive coding.
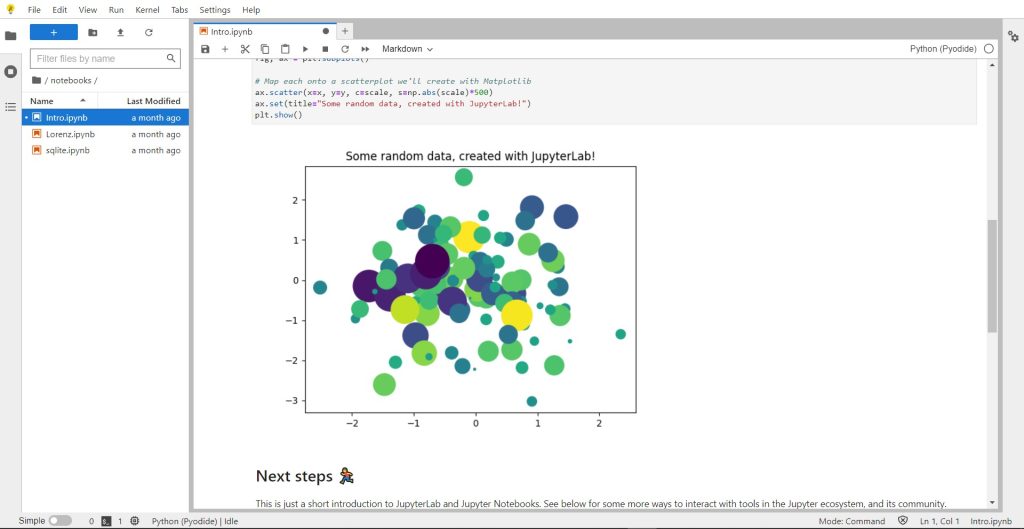
Jupyter Notebook
A data science tool that allows users to create, share, and collaborate on documents containing live code, equations, visualizations, and narrative text.
- Type(s): Data science, data analytics, data exploration, interactive computing, code documentation, and collaboration
- Price: Free
- Free Version Available: Yes
- Platforms: Web-based, Windows, macOS, Linux
- Website / Download Link: Jupyter
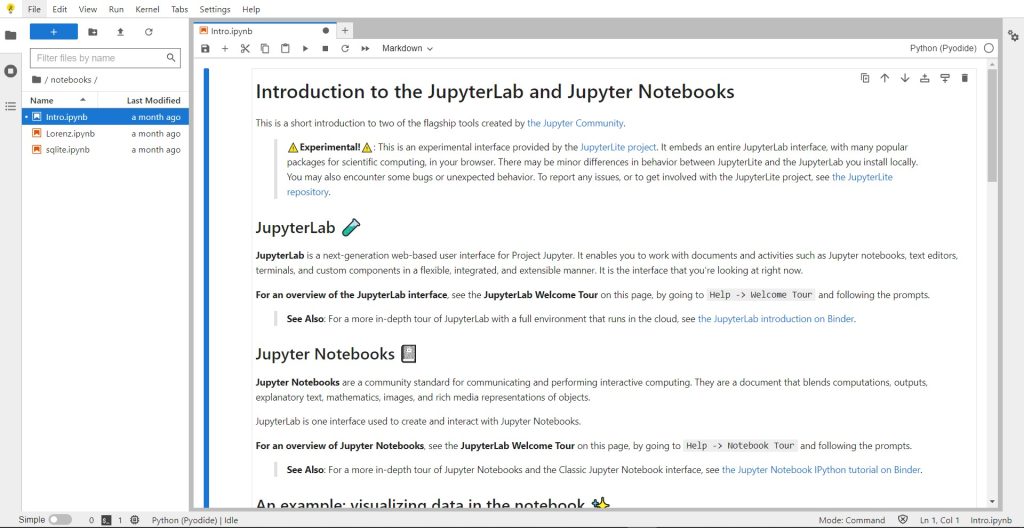
Jupyter Notebook is a widely-used, open-source data science tool that enables users to create, share, and collaborate on interactive documents containing live code, equations, visualizations, and narrative text.
Its versatility makes it ideal for a broad range of applications, from data exploration and analysis to code documentation and educational purposes.
Supporting over 40 programming languages, including Python, R, and Julia, Jupyter Notebook allows users to work seamlessly across different languages, making it an excellent choice for multi-disciplinary teams and collaborative projects.
Its interactive nature facilitates rapid iteration, enabling users to experiment, analyze results, and refine their code in real time.
Jupyter Notebook’s rich ecosystem of extensions and plugins further enhances its functionality, providing additional tools for data visualization, version control, and collaboration.
With its built-in support for sharing notebooks through email, GitHub, or other platforms, users can easily share their work and collaborate with others, fostering knowledge exchange and reproducible research.
Key Features
- Supports over 40 programming languages
- Live code, equations, visualizations, and narrative text in one document
- Collaboration features
Why You Should Consider
Jupyter Notebook is an excellent choice for data scientists and researchers looking for a flexible, collaborative tool that supports a wide range of programming languages.
Benefits of Data Analysis Software
Using data analysis software offers several key benefits for businesses:
- Maintaining a Database of Important Metrics: Data analysis tools help organizations track essential performance indicators, enabling data-driven decisions and easier collaboration.
- Streamlining Operations: Data analysis software helps organizations optimize productivity and resource allocation by identifying inefficiencies.
- Optimizing & Improving the Customer Experience: Data analysis reveals customer preferences and trends, enabling targeted marketing campaigns and improved customer satisfaction.
- Mitigating Risks: Data analysis software helps organizations identify potential risks and develop strategies to minimize their impact.
- Better Decision-Making: Actionable insights from data analysis enable informed decisions and improved business performance.
- Enhance Security: Data analysis tools often have built-in security features and can help identify potential security threats.
- Collaboration and Knowledge Sharing: Data analysis software facilitates collaboration and knowledge sharing among team members, leading to faster problem-solving and improved decision-making.
- Competitive Advantage: Organizations leveraging data analysis software can gain a competitive edge by uncovering insights and trends that drive strategic decisions.
FAQs
Are There Free Data Analysis Tools?
Yes, there are free data analysis tools available. Some popular options include Google Data Studio, Redash Open Source, RapidMiner Studio Free, and Jupyter Notebook. However, these free versions may have limited features compared to their paid counterparts.
Who Uses Data Analytics?
Data analytics is used by a wide range of professionals, including data scientists, business analysts, marketing professionals, financial analysts, and researchers. Organizations across various industries also use data analytics to make better decisions, optimize operations, and gain insights into customer behavior.
What are Some Examples of Data Analysis?
Data analysis can be applied in various scenarios, such as analyzing customer behavior patterns, predicting product demand, optimizing supply chain operations, detecting fraud, and exploring the effectiveness of marketing campaigns.
Is Python Good for Data Analysis?
Yes, Python is an excellent language for data analysis. It is widely used in data science, machine learning, and artificial intelligence due to its simplicity, flexibility, and extensive library support.
Final Thoughts
Selecting the best data analysis software depends on various factors such as scalability, analytical diversity, types of users, business requirements, learning curve, ease of use, integrations, file support, and pricing.
This comprehensive guide has provided an overview of some of the best data analysis software available, broken down into categories like business intelligence tools, data visualization tools, and data science tools.
By considering your organization’s specific needs and requirements, you can choose the right data analysis software to help you gain valuable insights, streamline operations, and make informed decisions.